Zooming with GestureDetector
In the previous post, I described how to create own chart using CustomPainter. Now I will go through adding zoom effect to the diagram using GestureDetector.
Starting point
At first, let’s define our starting point. I have own StatelessWidget that contains CustomPaintwith own CustomPainter. The main widget receives a list of all entries and passes only those from last 31 days. CustomPainter gets a new list of entries and uses the main Widget’s constant number of days. What I would like to achieve is that when a user “zooms in” the X-axis (number of days) changes respectively.
class ProgressChart extends StatelessWidget {  static const int NUMBER_OF_DAYS = 31;  final List<WeightEntry> entries;
  ProgressChart(this.entries);
  @override  Widget build(BuildContext context) {    return new CustomPaint(      painter: new ChartPainter(_prepareEntryList(entries)),    );  }  List<WeightEntry> _prepareEntryList(List<WeightEntry> initialEntries) {    //filters only those entries that are about to be shown in diagram  }}
class ChartPainter extends CustomPainter {  ...}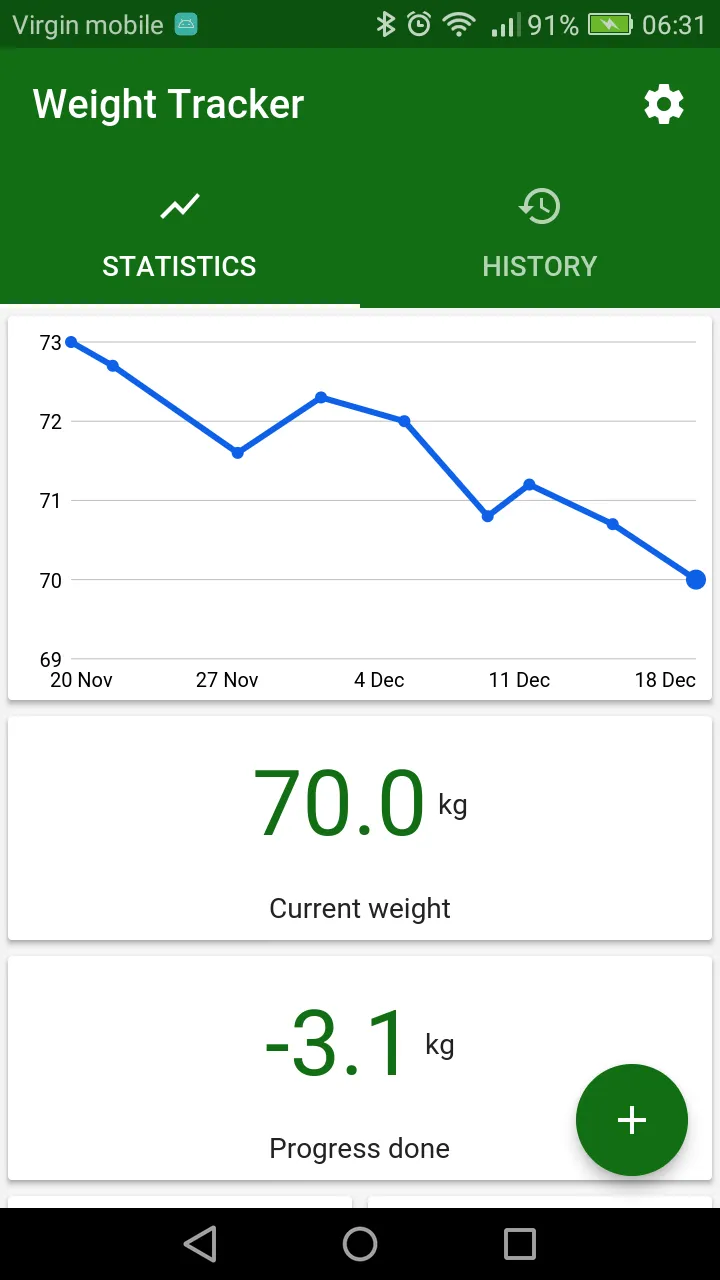
If you are interested in detailed specifics, see full code.
Adding GestureDetector
The best tool to handle gestures in Flutter is (surprisingly) GestureDetector. In my case, I used two of its features: onScaleStart and onScaleUpdate. Also, I needed to changed ProgressChartto be StatefulWidget to store and change the number of days since it is not a const anymore. This is how it looks like:
class ProgressChart extends StatefulWidget {  final List<WeightEntry> entries;
  ProgressChart(this.entries);
  @override  State<StatefulWidget> createState() {    return new ProgressChartState();  }}
class ProgressChartState extends State<ProgressChart> {  int numberOfDays = 31;  int previousNumOfDays;
  @override  Widget build(BuildContext context) {    return new GestureDetector(      onScaleStart: (scaleDetails) => setState(() => previousNumOfDays = numberOfDays),      onScaleUpdate: (ScaleUpdateDetails scaleDetails) {        setState(() {          int newNumberOfDays = (previousNumOfDays / scaleDetails.scale).round();          if (newNumberOfDays >= 7) {            numberOfDays = newNumberOfDays;          }        });      },      child: new CustomPaint(        painter: new ChartPainter(_prepareEntryList(widget.entries), numberOfDays),      ),    );  }
How it works:
- When zoom gesture starts I store the current number of days.
- When zoom updates I get the scale and divide the previous number of days by it. Notice that I am changing only the current number of days, not the previous one. If I updated the starting point, the number of days would quickly go towards infinity or 0 depending on gesture.
- I added border value so max zoom is one week.
- At the end, I refactored ChartPainter to accept numberOfDays instead of referencing constant value.
Wrapping up
After small adjustments to bottom labels, final effect looks like this:
And that’s it! As you can see it was pretty straight forward. 🙂
If you are interested in more details, see my GitHub repository or previous post on creating charts.